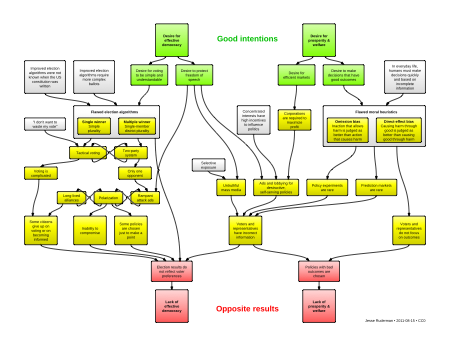
If you are looking for another way for students to demonstrate their knowledge, you might want to check out Lucid Charts. Students can create digital flowcharts/diagrams that include text, images, videos, etc. One example idea: Students can track character interactions throughout a text. They can connect characters through explaining the relationship or conflict. They can also add text to describe each character and his/her development. PLEASE NOTE: If you think you might utilize this tool, please visit this site sooner rather than later. Lucid Charts does require you to upgrade to free educator version, and it seems this process can take about a week. The educator version allows your students to do more with their charts.
(PS - I know it is hard to read the boxes in the example above, but I wanted people to be able to visualize a possible end product.)
No comments:
Post a Comment